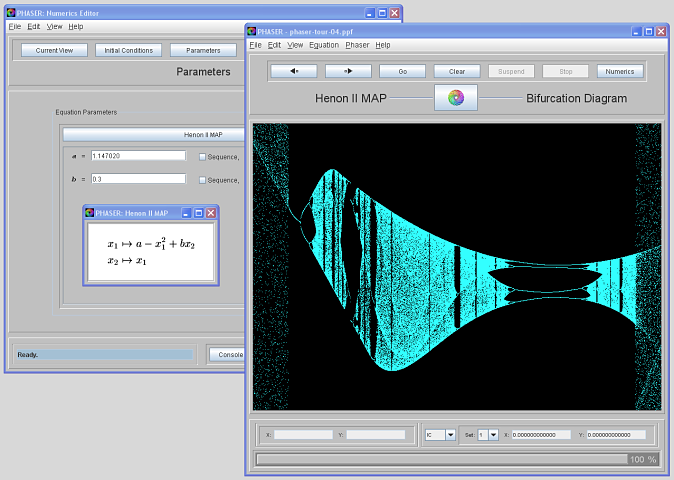
An extreme enlargement of a portion of the Bifurcation Diagram of the famous Hénon map (x1, x2) -> (a - x12 + b x2, x1). The parameter a, plotted on the X-Axis, is varied from 1.147020 to 1.147062, while the parameter b is fixed at 0.3. The x1 coordinate is plotted on the Y-Axis in the range from -0.089 to -0.082. Notice the coexistence of period-doubling and period-halving bifurcations.
4 of 6