Chapter 1: The Stability of One-Dimensional Maps
Section 1.5: Fixed (Equilibrium) Points
-
The fixed points of a one-dimensional MAP can be located graphically as the points of intersections of the graph of the MAP with the 45-degree line. In this section we will see several illustrations of this technique for locating fixed points.- Example: Cubic MAP
Consider the cubic map of the form
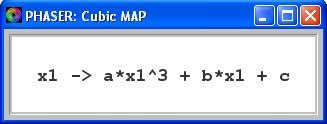 (1)
(1)
where a, b, and c are parameters.
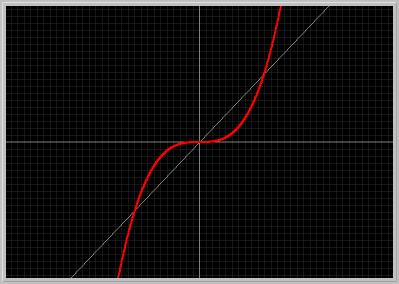
Figure 1.5.1. The graph of the Cubic MAP in Eq.(1) for a = 1, b = 0, c = 0. Notice that there are three fixed points, the points of intersections of the graph of the map and the 45-degree line.Activities:
- Click on the picture to load it into your local copy of Phaser.
- Move your mouse cursor (without clicking) and determine the coordinates of the three fixed points. (PhaserTip: Cursor Coordinates)
- Set the parameter to c = 0.5. (PhaserTip: Changing Parameters) Clear and Go. What happens to the number of fixed points?
- Example 1.5: Logistic MAP
Consider the quadratic map of the form
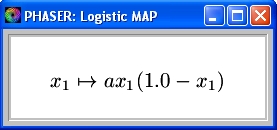 (2)
(2)
where a is a parameter in the range [1, 4]. In the Gallery figure below the graph of the map and the 45-degree line are plotted as the parameter a is varied from 1 to 4 with increments of 0.2.
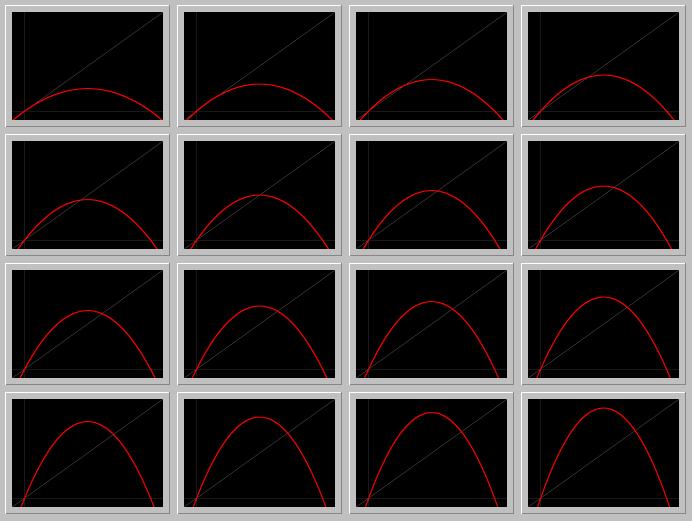
Figure 1.5.2. Logistic MAP in Eq.(2) as the parameter a is increased from 1 to 4. Notice that the origin is a fixed point for all values of the parameter a. As a is increased another fixed point appears.Activities:
- Click on the Gallery picture to load it into your local copy of Phaser.
- In the spawned Phaser Gallery window, click the Slideshow button on the button bar. Now a new Slideshow window should pop. On this window, click the Play button. Further information on Slideshow is available in (PhaserTip: Slideshow). Observe how the graph of the parabola changes as the parameter a is increased.
- Double click on one of the frames in the Gallery to load it into Phaser for further experimentation.
- By changing the values of the parameter a (PhaserTip: Changing Parameters) determine the lowest value of a for which there are two fixed points.
- Move your mouse cursor (without clicking) and determine the coordinates of the two fixed points. (PhaserTip: Cursor Coordinates)
- Example 1.6: The Tent MAP
In this example, we will examine the piece-wise linear Tent MAP of the from
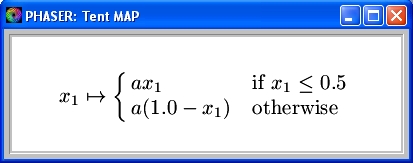
where a is a parameter. In the figure below, the graph of the Tent MAP for the parameter value a = 2.0 and the 45-degree line are plotted.
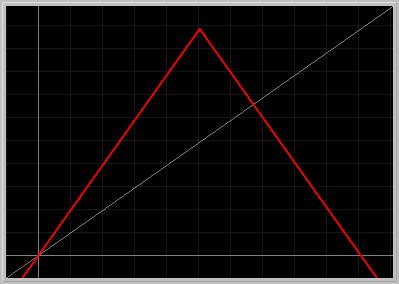
Figure 1.5.3. Two fixed points of the Tent MAP for a = 2.0.Activities:
- Click on the picture to load it into your local copy of Phaser.
- Move your mouse cursor (without clicking) and determine the coordinates of the two fixed points. (PhaserTip: Cursor Coordinates)
- Set the parameter to a = 1. (PhaserTip: Changing Parameters) Clear and Go. What happens to the number of the fixed points?
- Set the parameter to a = 0.5. (PhaserTip: Changing Parameters) Clear and Go. What happens to the number of the fixed points?
- Example: Cubic MAP
[ Previous Section | Next Section | Main Index | Phaser Tips ]